Archodex Dashboard
The Archodex Dashboard makes it easy to understand workloads, resources, environments, events, and issues. This page will walk you through all the major features of the Archodex Dashboard and how to use them to accomplish your DevSecOps tasks more quickly and safely.
1. Graph View
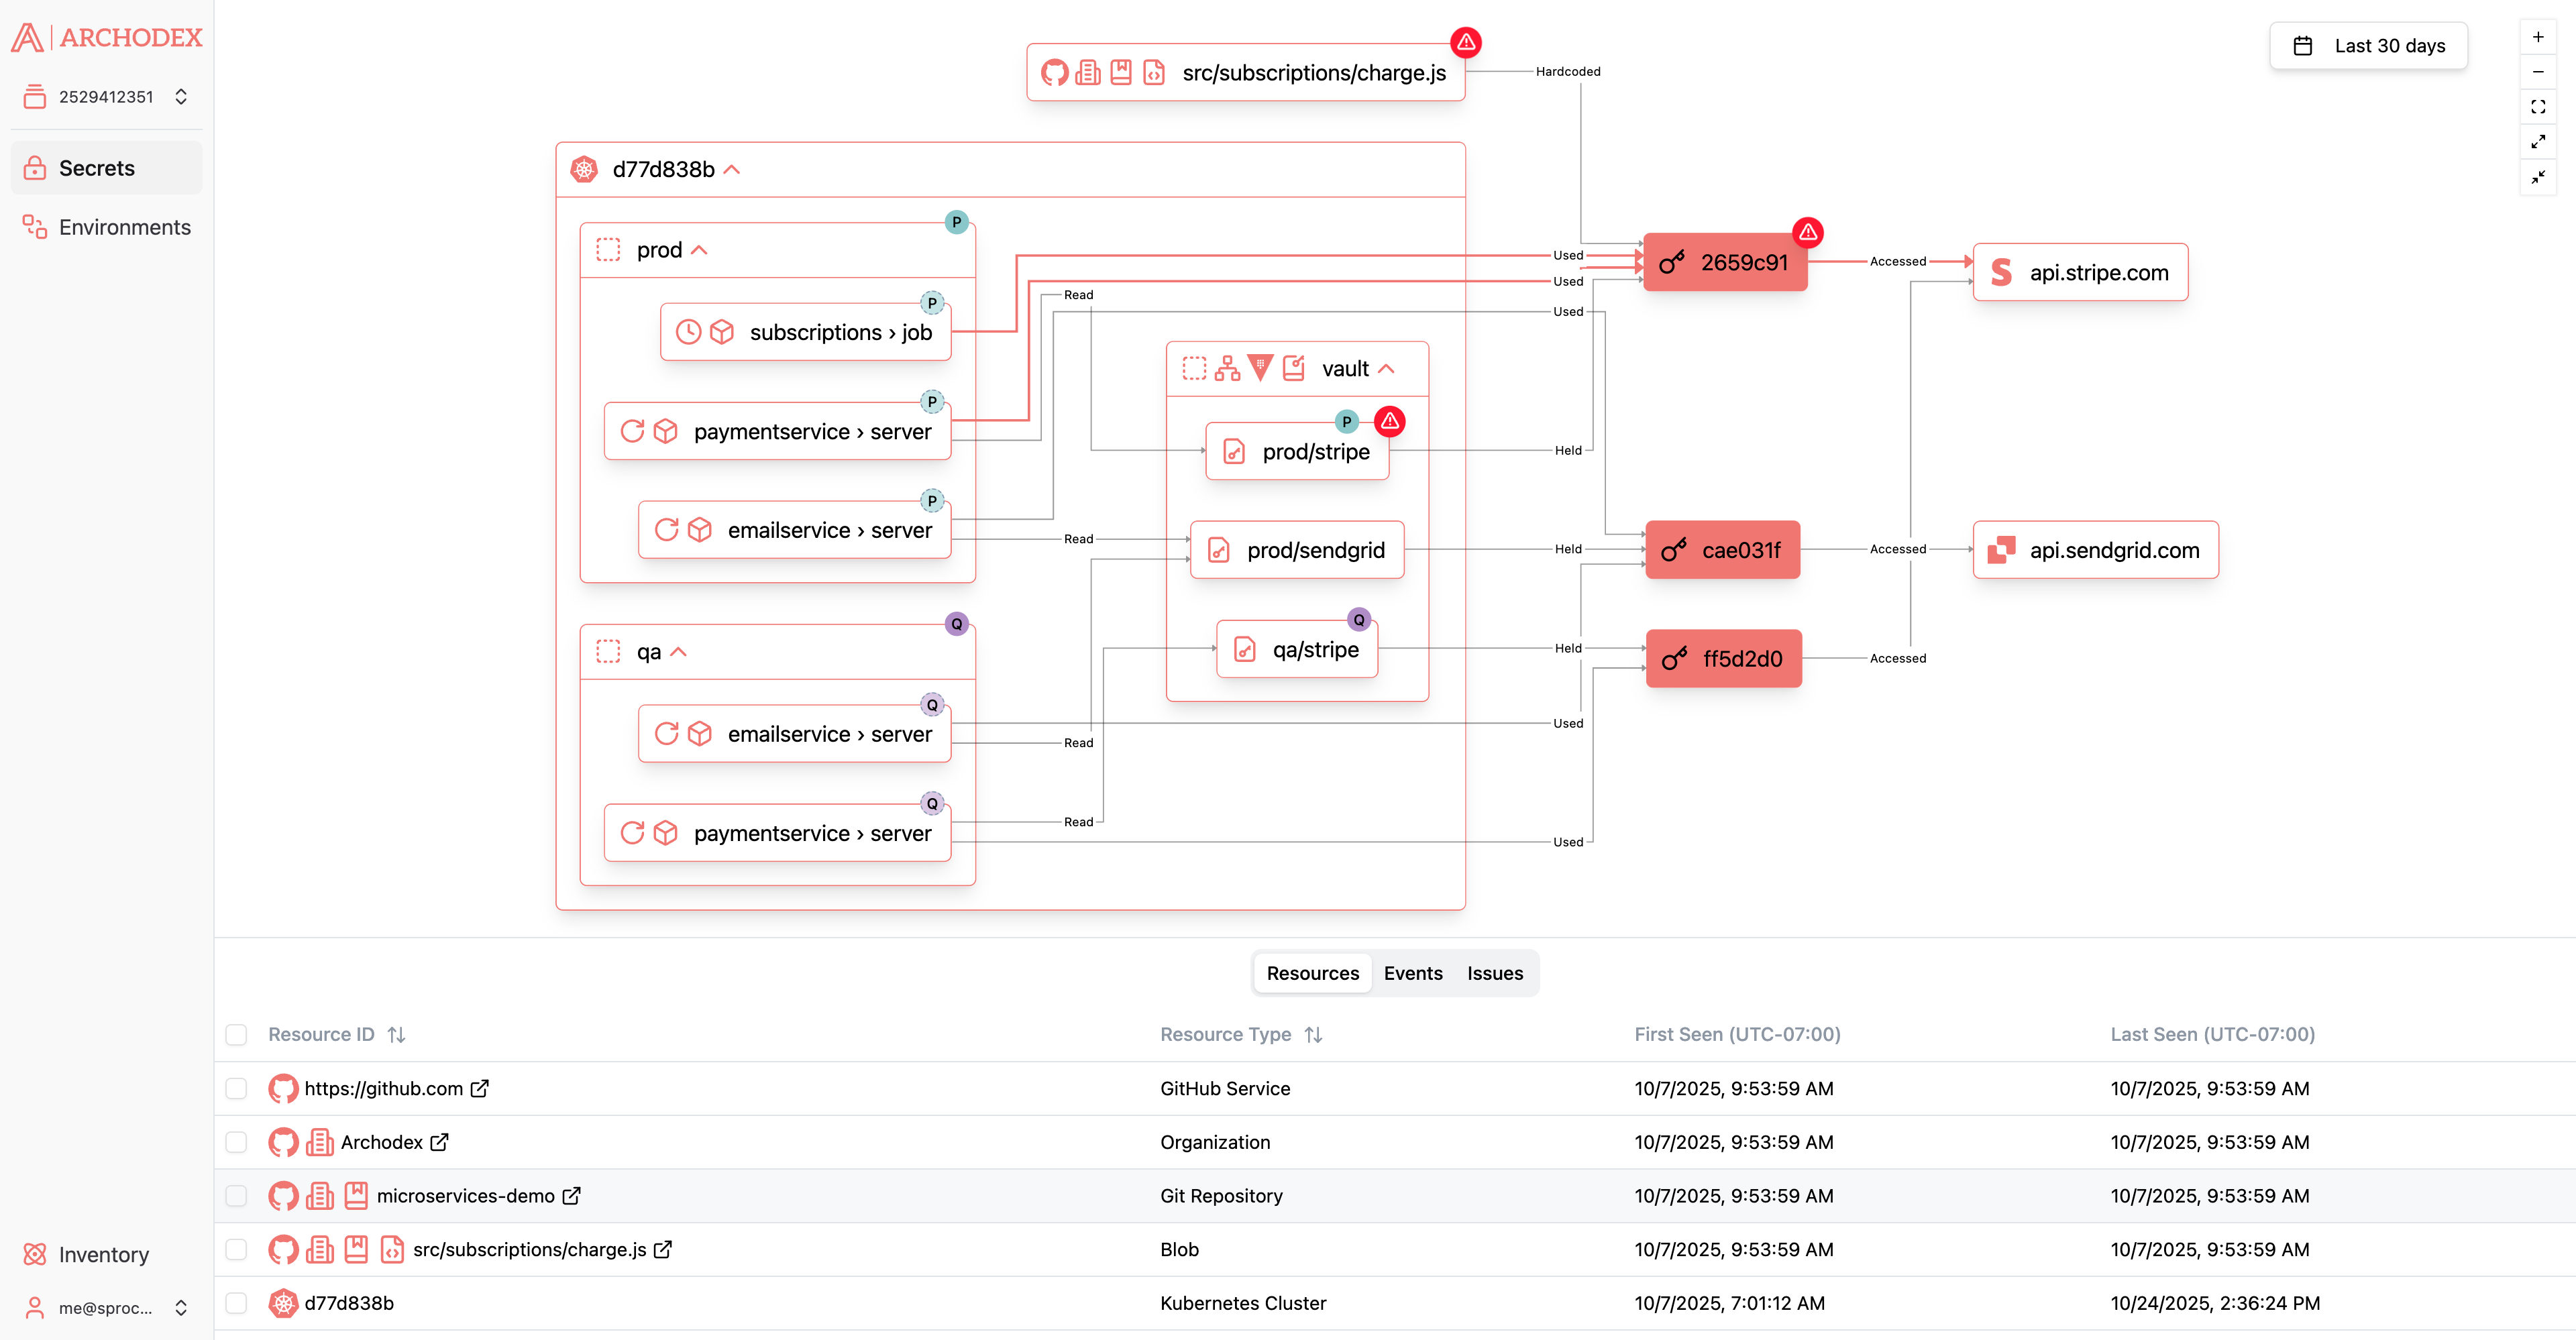
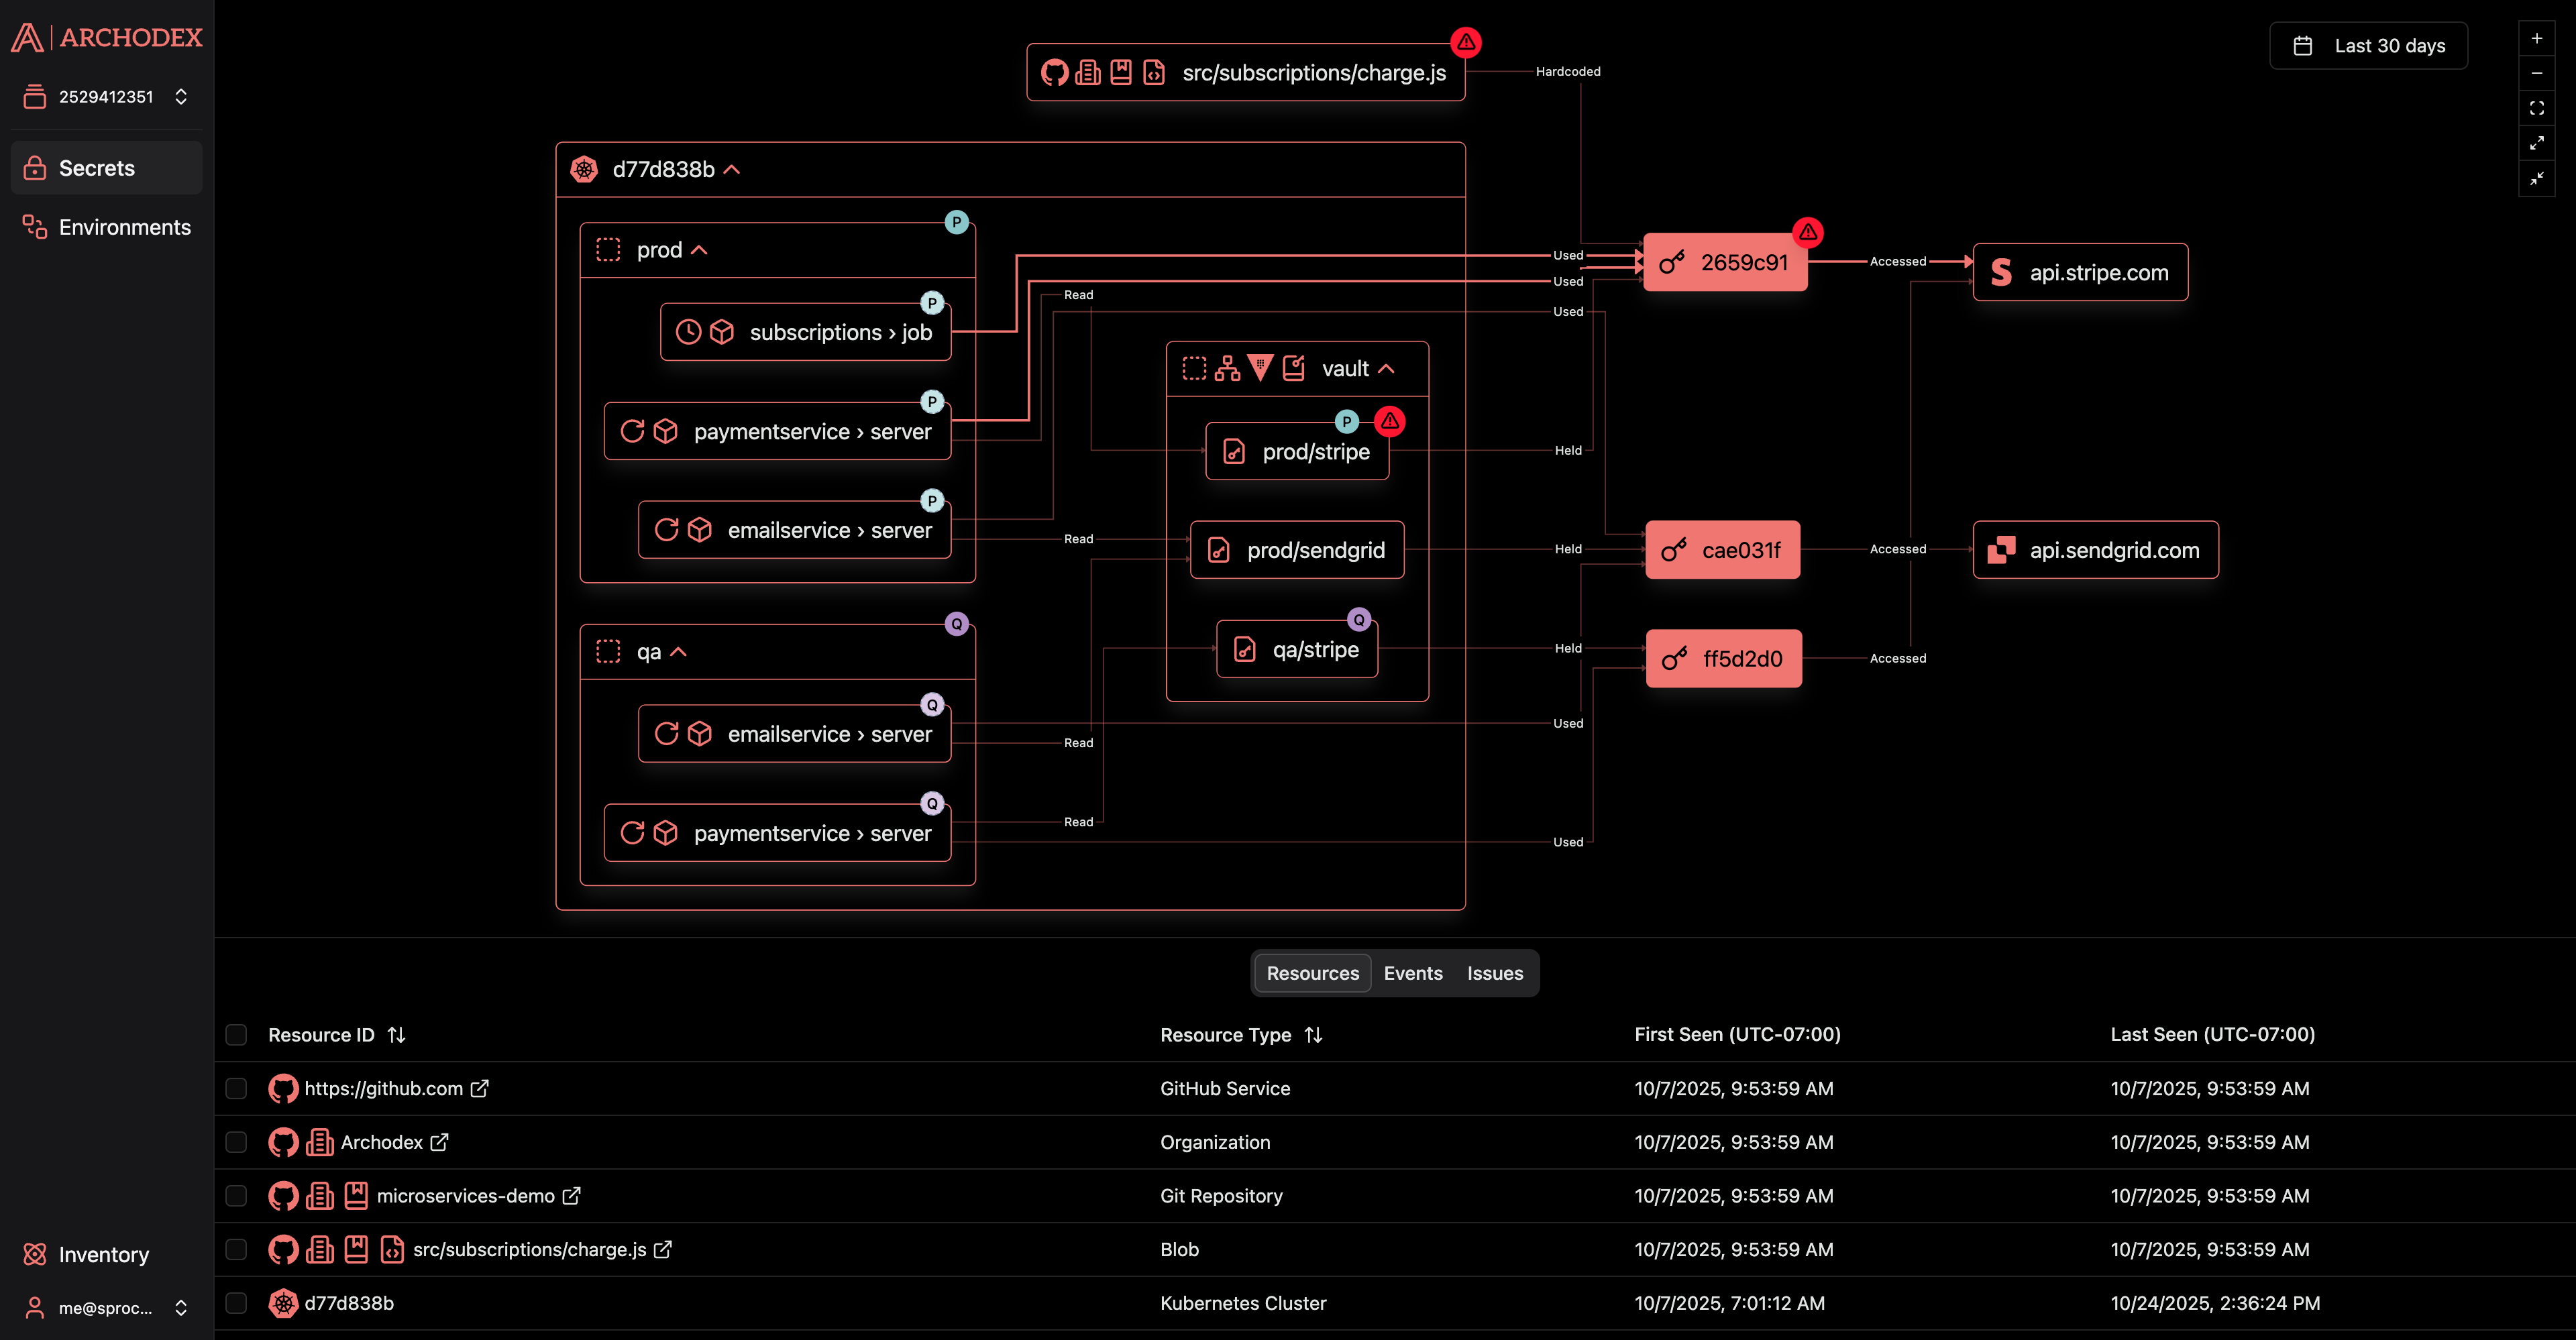
Section titled “1. Graph View”The Graph View provides a high-level overview of your applications and their interactions with services. You can use the Graph View to quickly identify which workloads are using specific secrets, services, or resources.
Resources can be clicked on to select them and the events they participated in. Multiple resources can be selected when holding the
Selected resources and events will also be selected in the Table View below the graph, making it easy to cross-reference selections.
2. Table View
Section titled “2. Table View”The Table View provides a detailed list of resources, workloads, and events. You can use the Table View to filter and search for specific items and drill into their details.
Resources can be selected by checking the box to the left of each row. Multiple resources can be selected when holding the
Selected resources and events will also be selected in the Graph View above, making it easy to cross-reference selections.
There are three tabs in the Table View:
Resources Table
Section titled “Resources Table”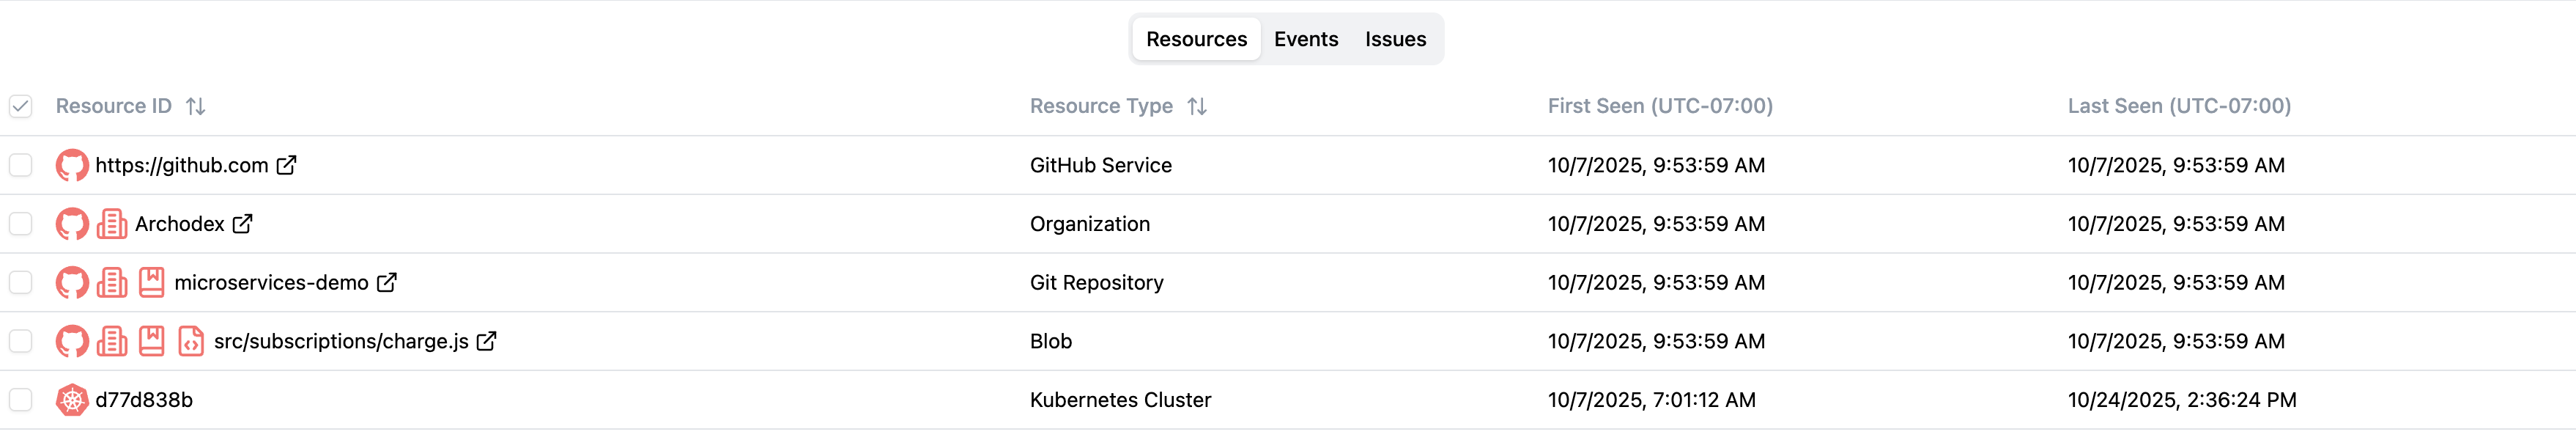
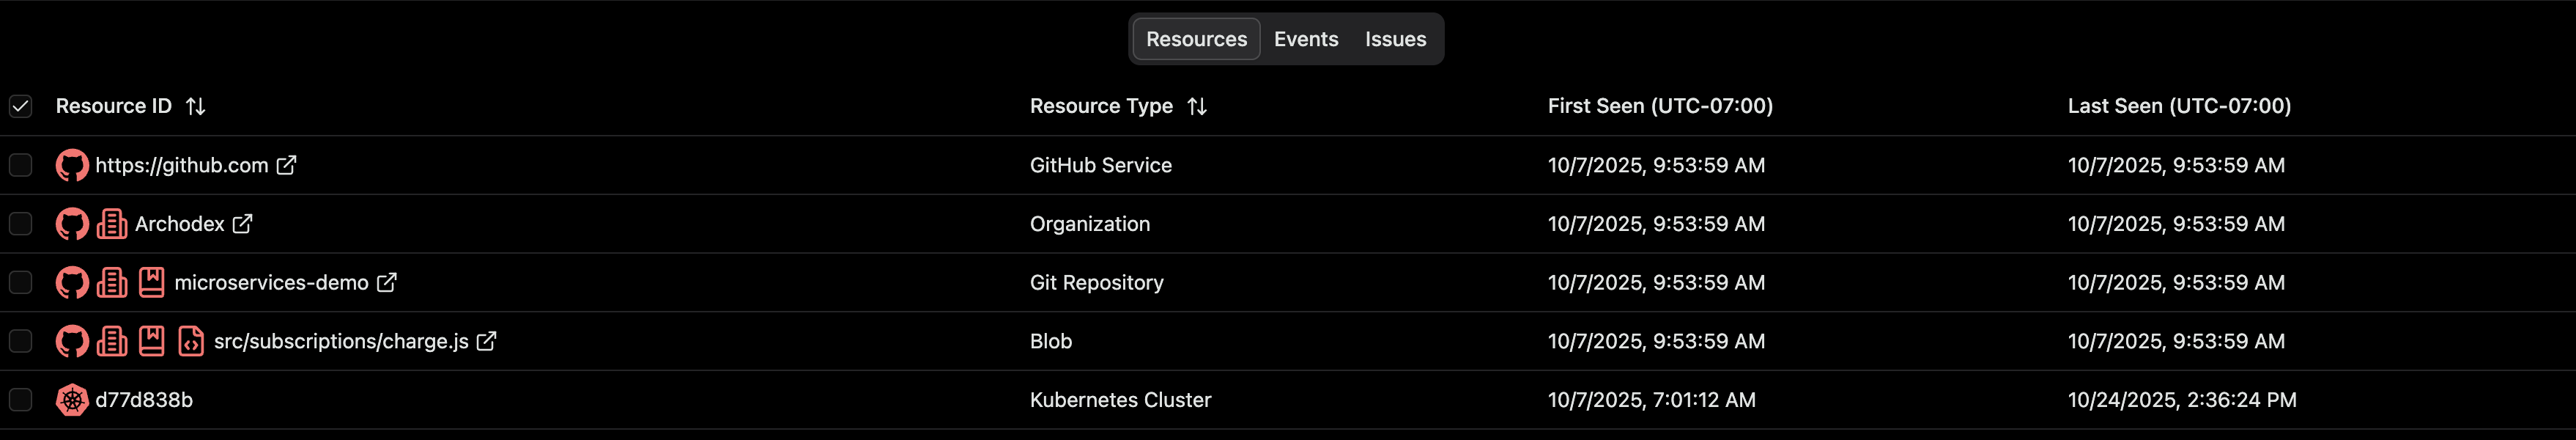
The Resources tab provides a detailed list of all resources observed by the Archodex Agent within the chosen date range along with links to the resource (where applicable) and timestamps of when the resource was first and last observed within the date range.
Selecting a resource in the table will also select it in the Graph View above. If the resource is hidden inside collapsed parent resources, the parent resources will be expanded. This can help you quickly locate resources of interest in the Graph View.
Selecting a resource in the table will also select it and its associated events in the Graph View above. If the resource is hidden inside collapsed parent resources, its parent resources will be expanded. This can help you quickly locate events of interest in the Graph View.
Events Table
Section titled “Events Table”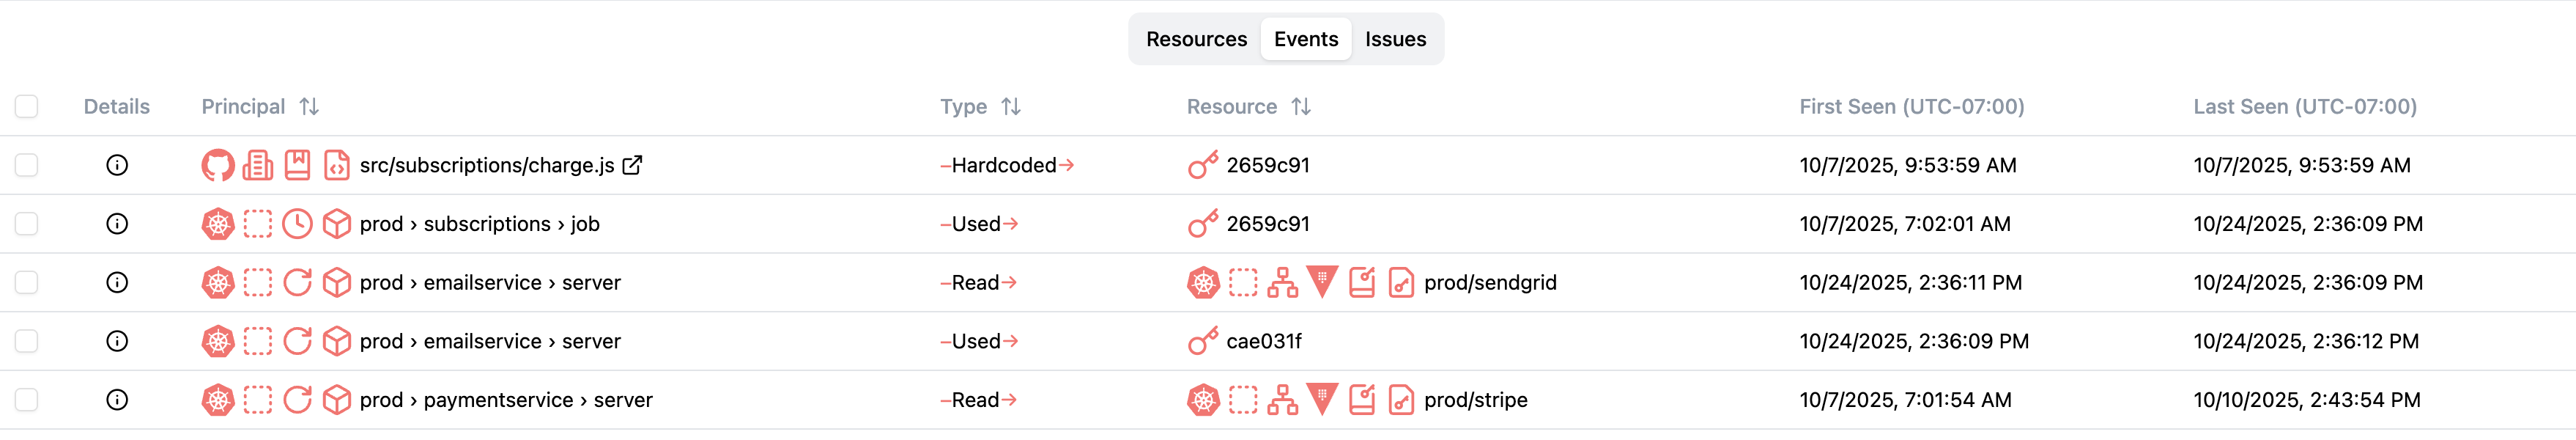
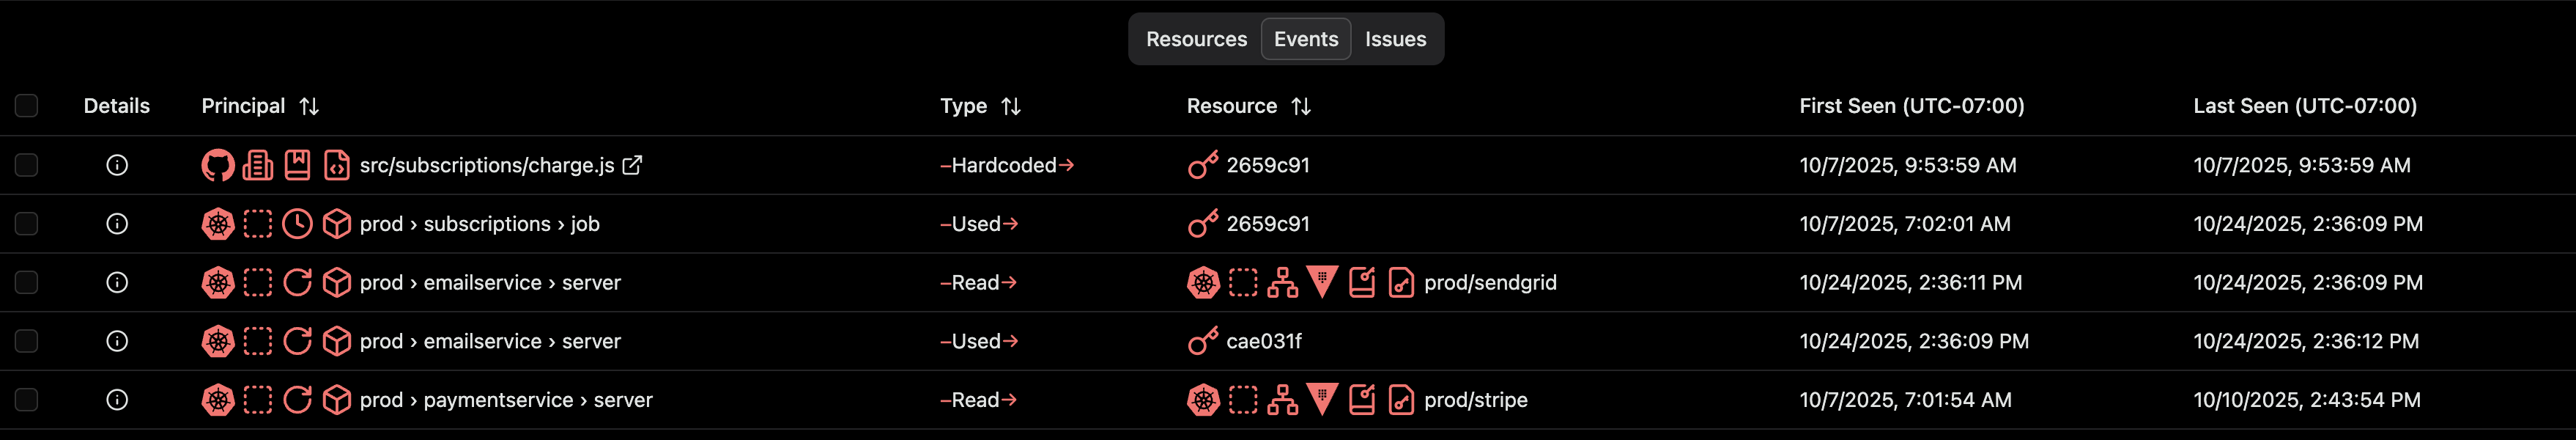
The Events tab provides a detailed list of all events observed by the Archodex Agent within the chosen date range along with timestamps of when the event was first and last observed within the date range.
Each row represents one direct event that a Principal resource performed on a Target resource. These events may also be part of a larger chain of events that make up a higher-level operation, such as a secret retrieval or an API call. Clicking on the Details button for an event will show more information about it and the other events in the same operation.
Selecting an event in the table will also select it and its associated resources in the Graph View above. If the event and/or resources are hidden inside collapsed parent resources, the parent resources will be expanded. This can help you quickly locate events of interest in the Graph View.
Event Details
Section titled “Event Details”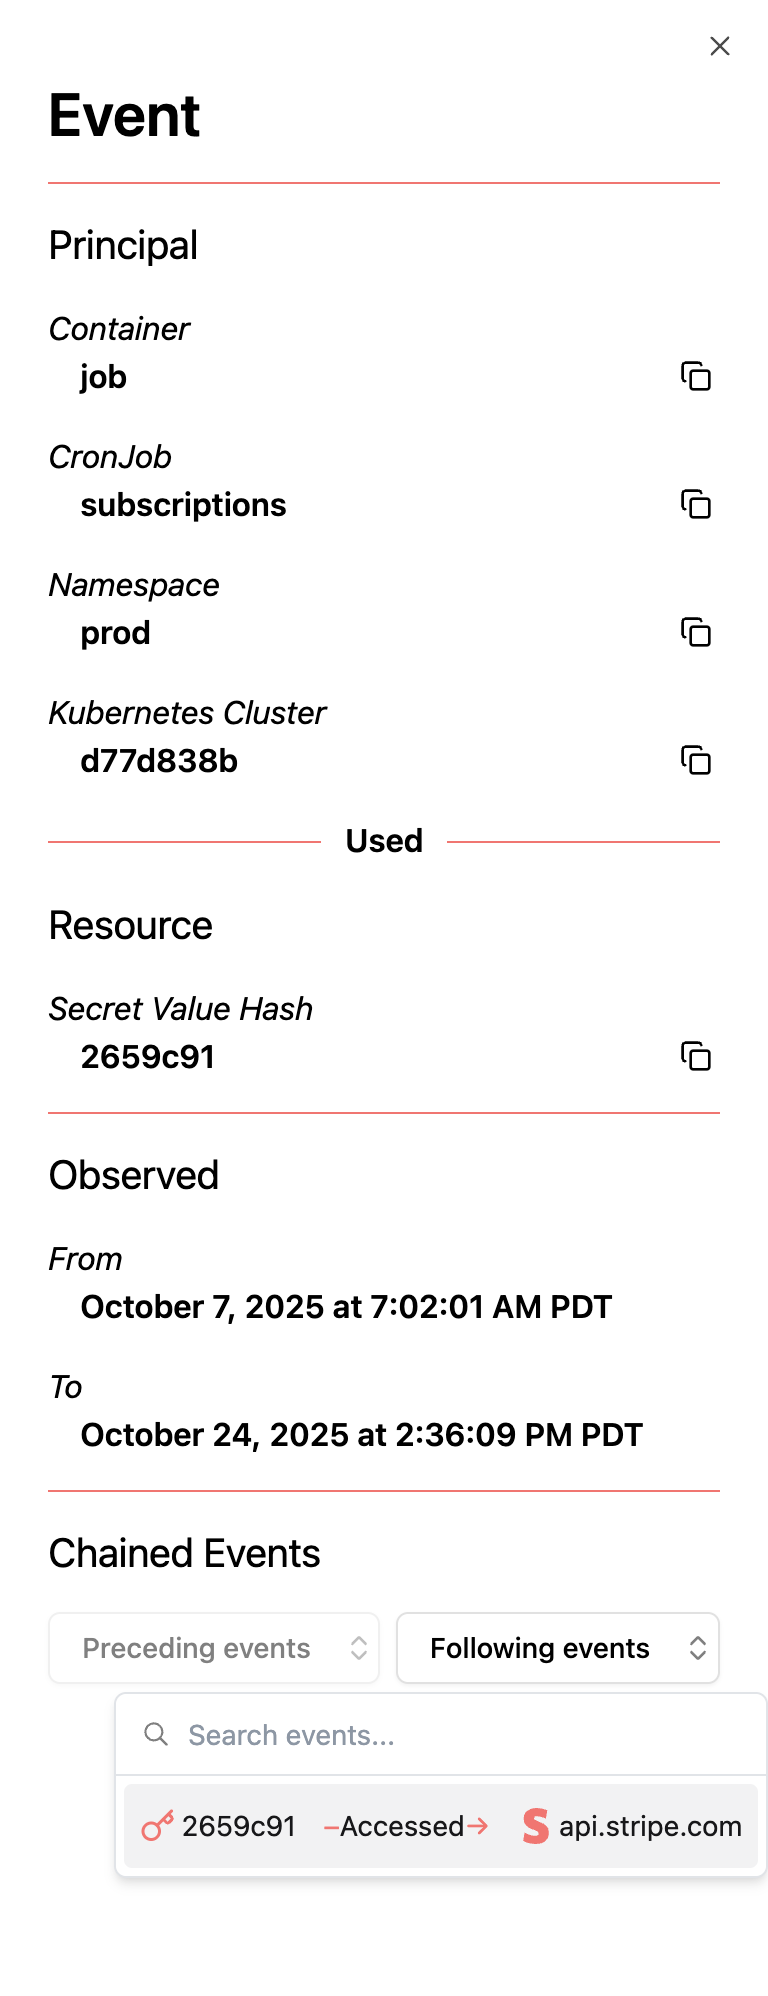
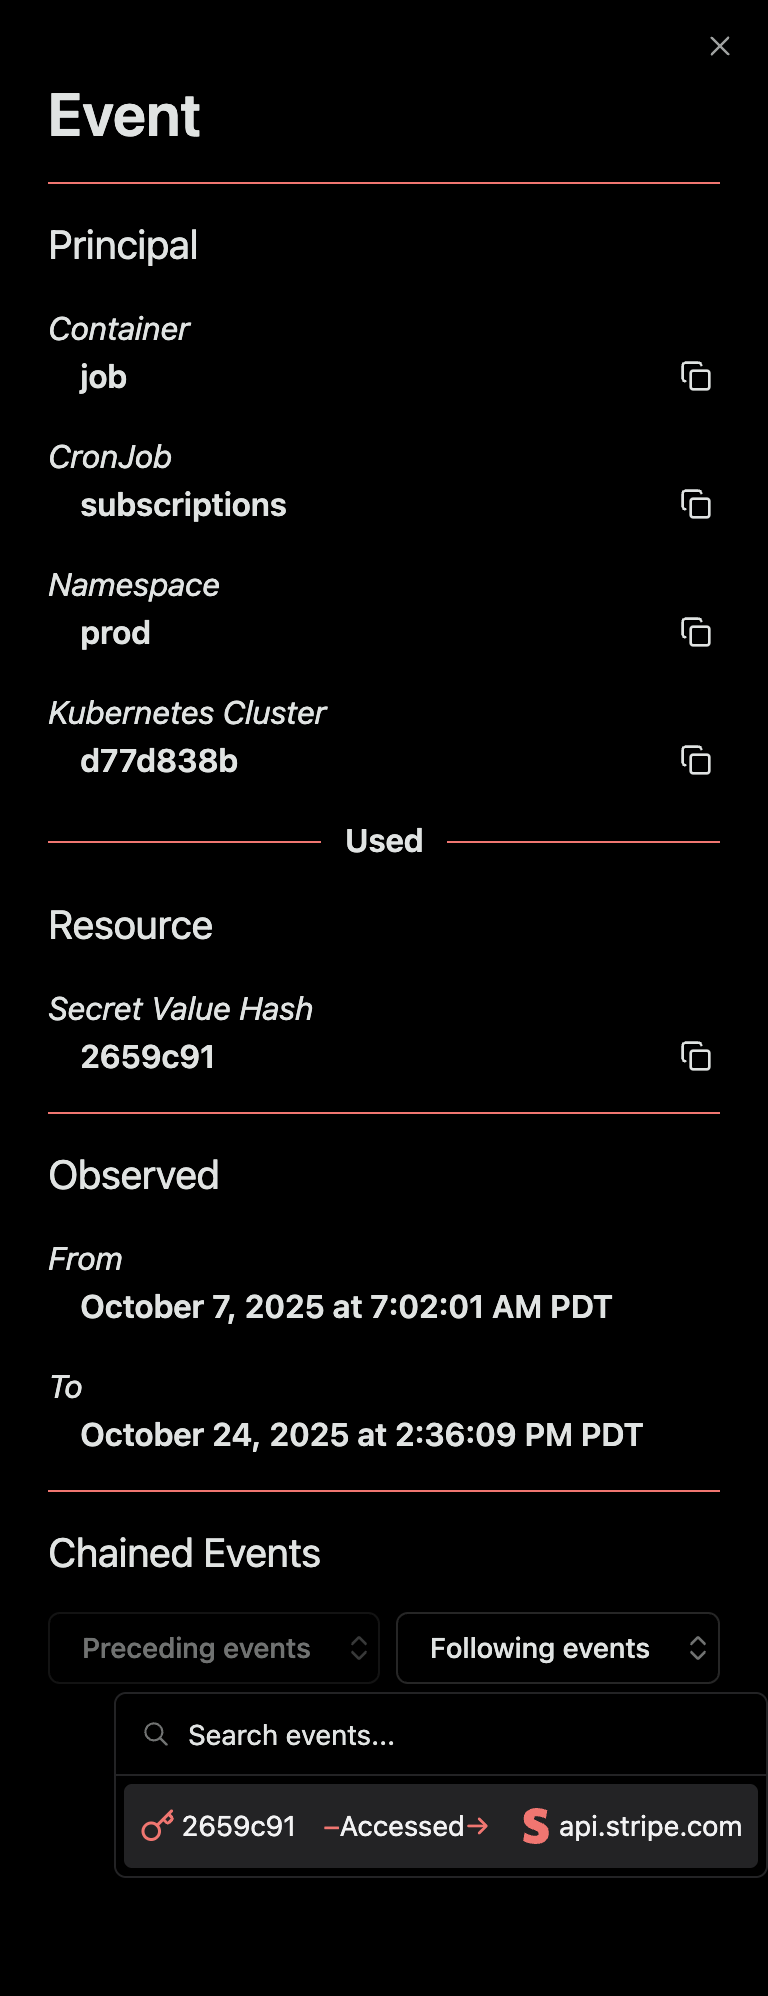
Clicking on the Details button for an event in the Events tab will open the Event Details panel. This panel shows more information about the selected event as well as other events that are part of the same higher-level operation. For example, in this screenshot we are looking at the detail of a job container that Used a secret value. At the bottom of the panel we see in the following event of this operation the secret value was used to Access the Stripe API.
Issues Table
Section titled “Issues Table”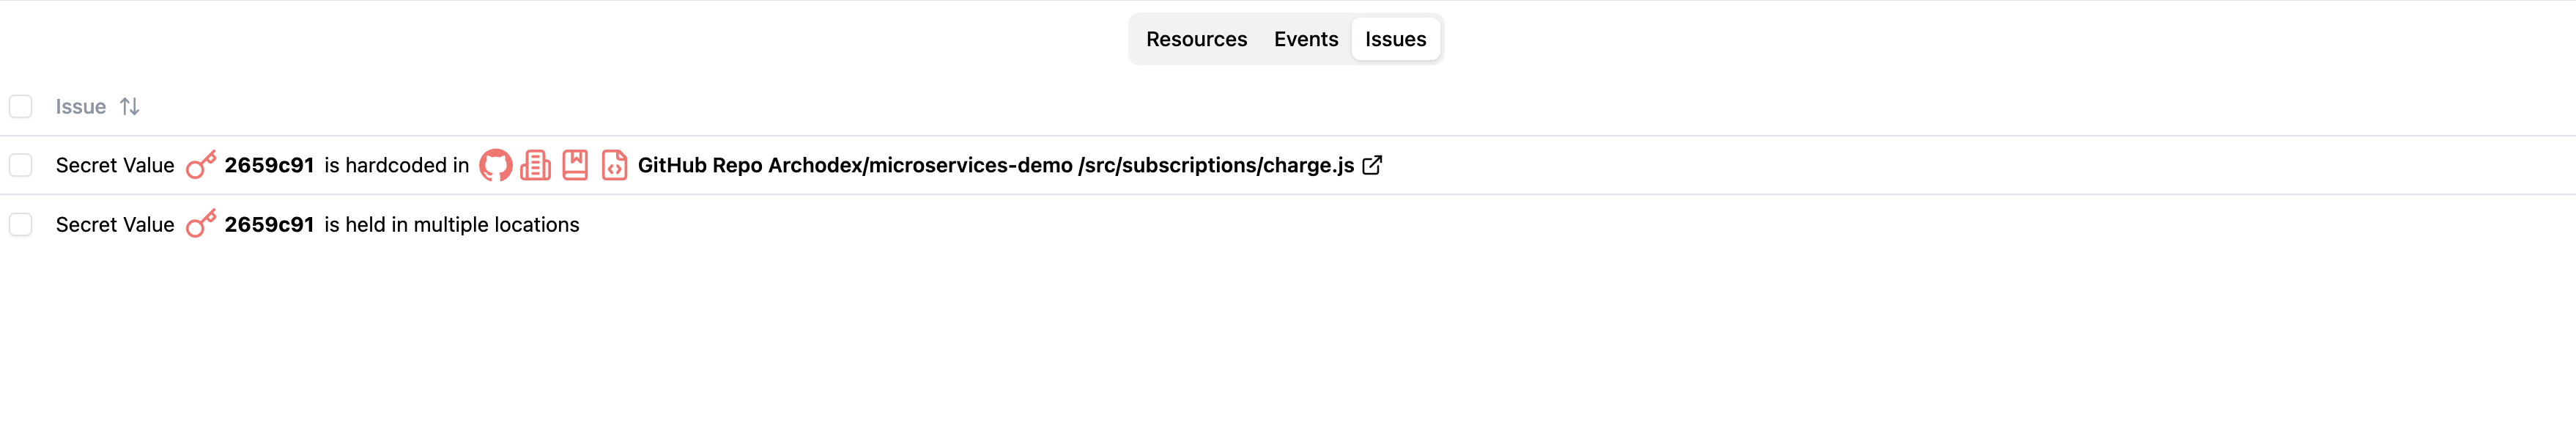
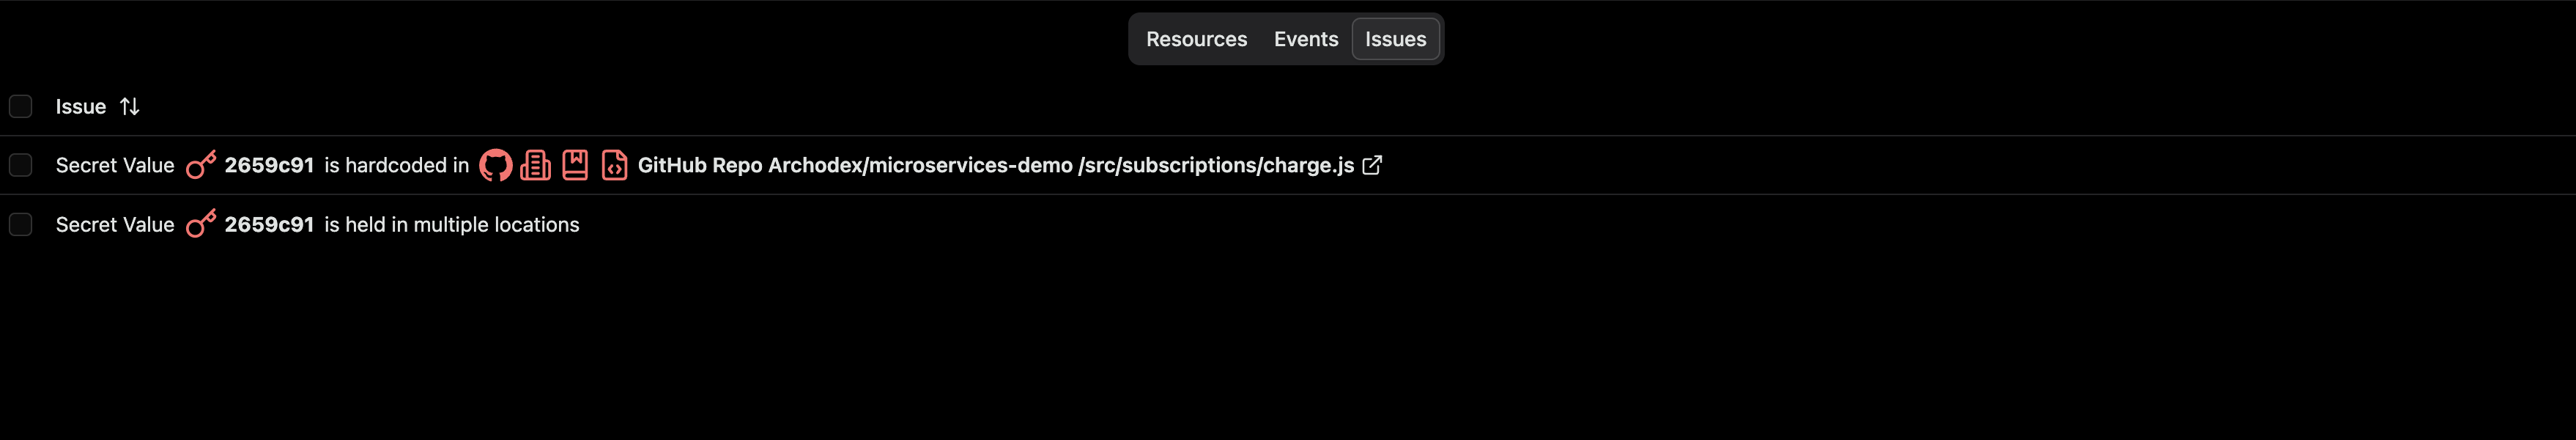
The Issues tab provides a detailed list of all issues detected by Archodex within the chosen date range. Each issue is described with a message and links (where applicable) to affected resources.
Selecting an issue in the table will also select its associated resources and events in the Graph View above. If the resources and/or events are hidden inside collapsed parent resources, the parent resources will be expanded. This can help you quickly locate issues of interest in the Graph View.
3. Date Range Selector
Section titled “3. Date Range Selector”The Date Range Selector allows you to filter the data displayed in the Dashboard by a specific time range. You can use the Date Range Selector to focus on recent events or to analyze historical data. Only observations of events and resources seen within the selected date range will be displayed. This filtering applies to both the Graph View and the Table View.
4. Graph Controls
Section titled “4. Graph Controls”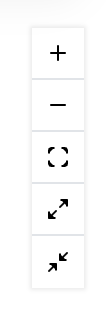
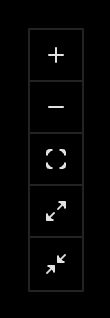
There can be many resources in the Graph View. The Graph Controls make it easier to navigate and understand the graph.
The + / - buttons allow you to zoom in and out of the graph. The square Fit View button will automatically adjust the zoom level to fit all the resources in the view.
The expand and collapse buttons allow you to expand or collapse all resources in the graph. Expanding a resource will show all the resources it contains, while collapsing a resource will hide them. These buttons are especially useful when working with complex applications that have many nested resources.
5. Resources
Section titled “5. Resources”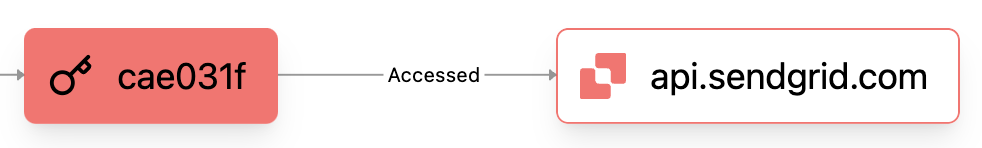
Resource nodes in the Graph View represent individual resources observed by the Archodex Agent. Resources can be workloads, clusters, secrets, API services, etc.
In some views resources of a certain type are highlighted. For example, in these screenshots of the Secrets view all Secret Value resources are highlighted.
Resource Icons
Section titled “Resource Icons”Resources may be part of a hierarchy. When parent resources contain only single child resources the Graph View displays them as a single node with icons for each resource in the hierarchy. Hovering over these icons will show a tooltip with the names of each resource in the hierarchy.
6. Containing Resources
Section titled “6. Containing Resources”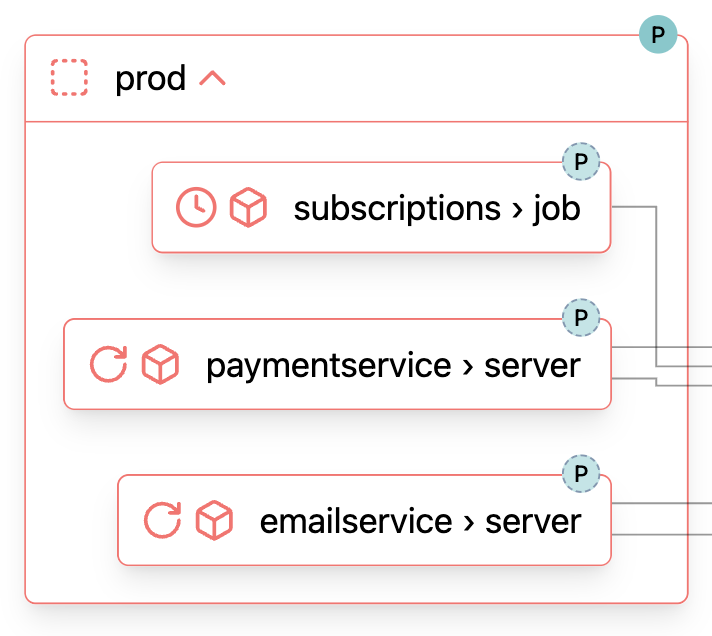
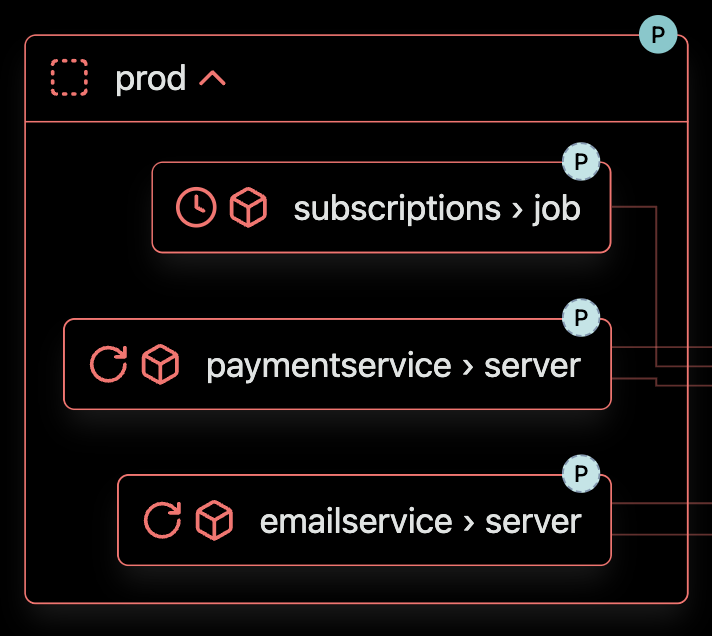
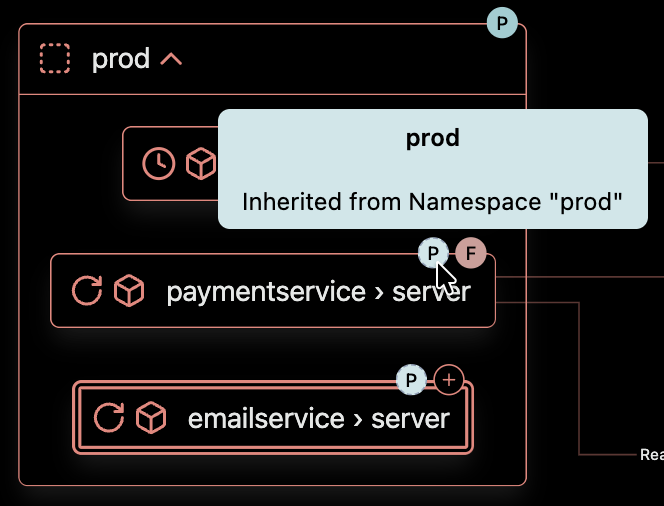
Some resources contain multiple child resources in a hierarchy. For example, the Kubernetes Namespace prod shown in the above screenshot was observed to contain three workloads. These resources can be expanded and collapsed by clicking on the chevron icon to the right of the resource name.
7. Selected Events
Section titled “7. Selected Events”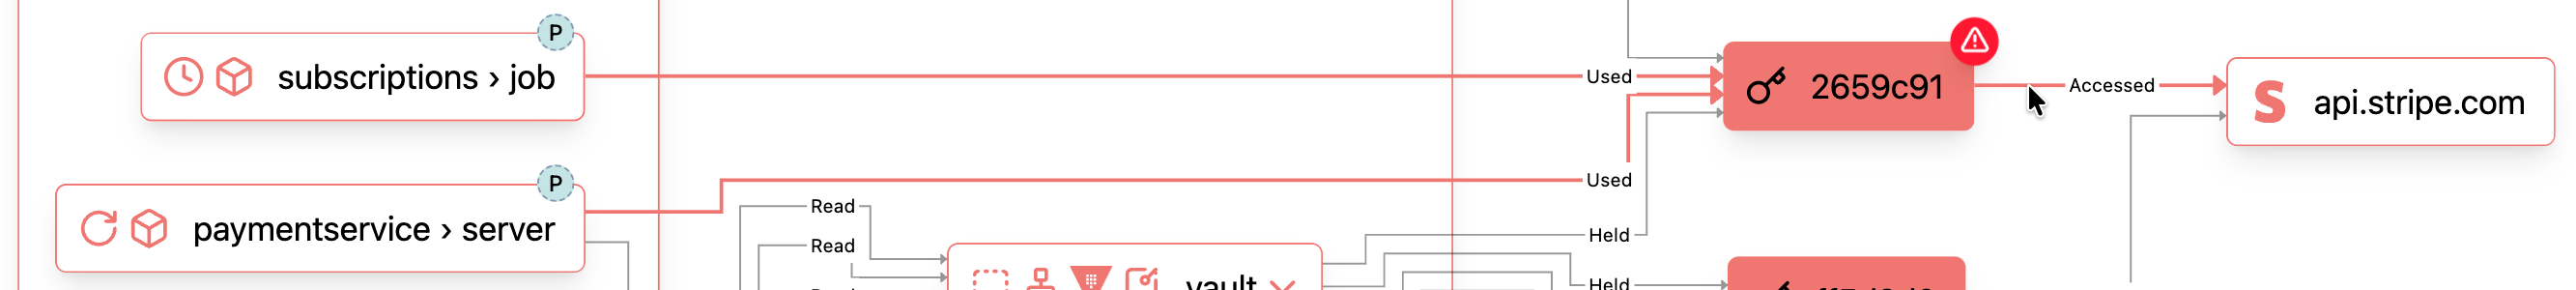
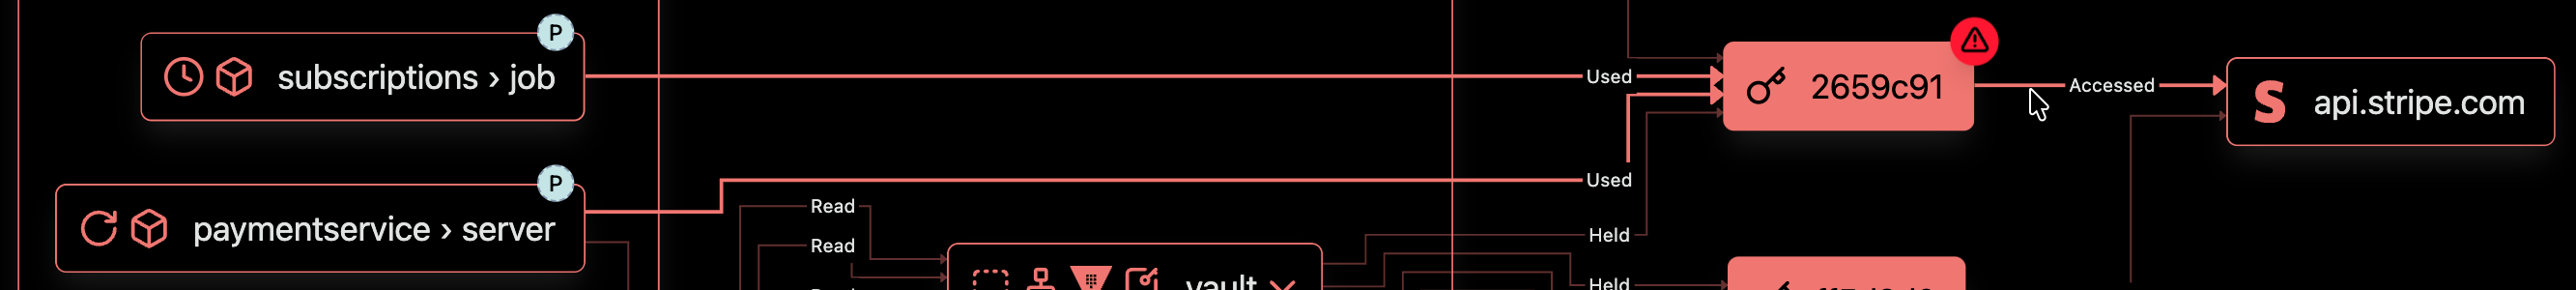
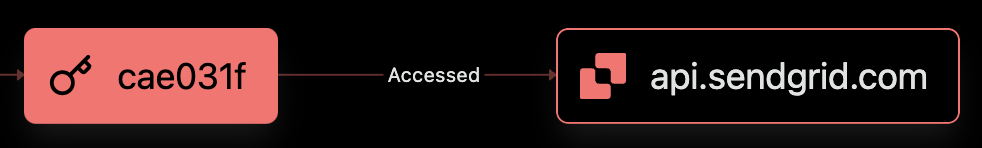
When an event is hovered over or clicked on in the Graph View, the event, and other related events in the same high-level operation, become highlighted. For example, in the above screenshot we clicked the Accessed event that represents a specific Secret Value being used to access the Stripe API, and this automatically selected the events that were part of the same high-level operations. In this case, because two different container workloads used the same Secret Value to access the Stripe API, the events from both workloads that Used the secret were also selected.
8. Environment Tags
Section titled “8. Environment Tags”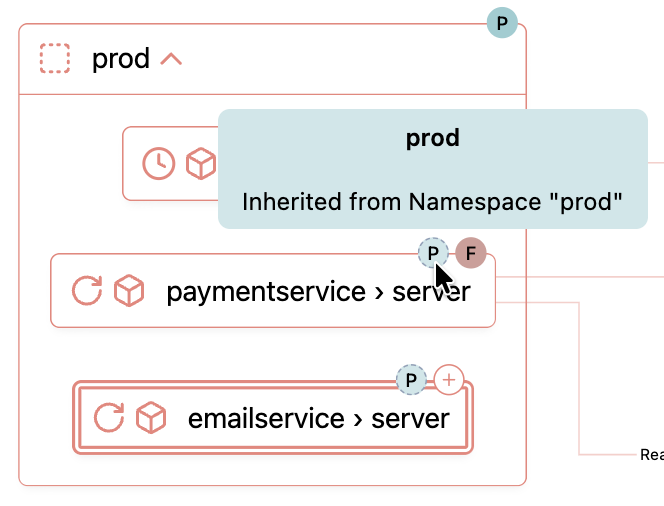
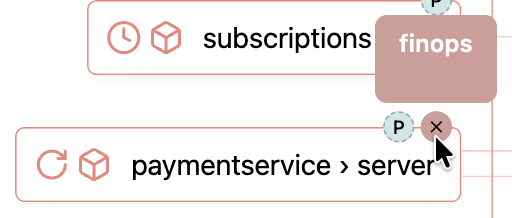
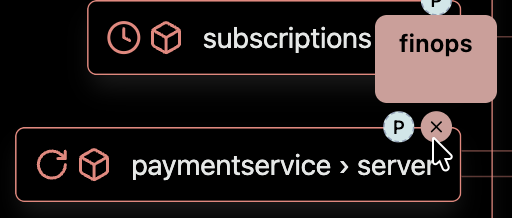
Archodex makes it easy to assign environments to resources in the Dashboard. Environment tags are displayed on resources in across the top right side of the resource node in the Graph View. These tags contain the first character of the environment, but the full environment name is shown when hovering over the tag.
Archodex environments are hierarchical. In the above screenshot we see the paymentservice › server resource is tagged with the prod environment because the prod environment was assigned to the parent Kubernetes Namespace resource (which in this example happens to also be named prod).
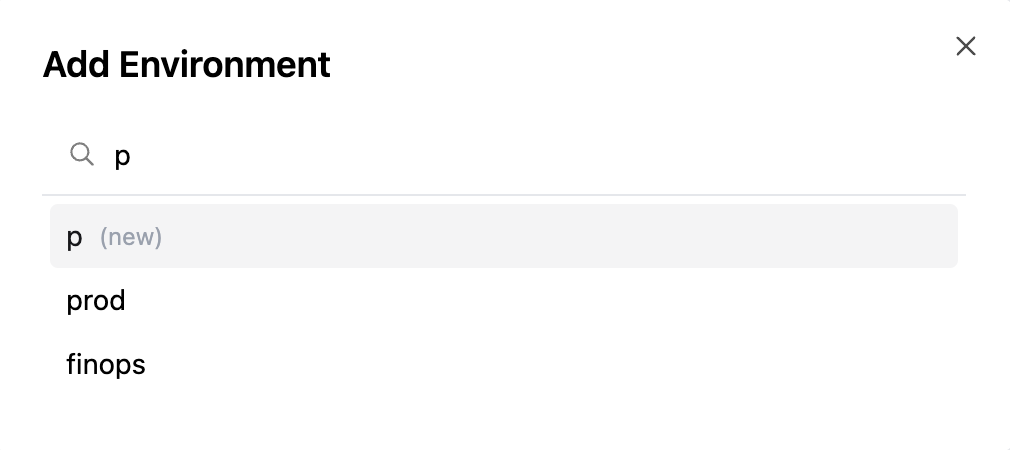
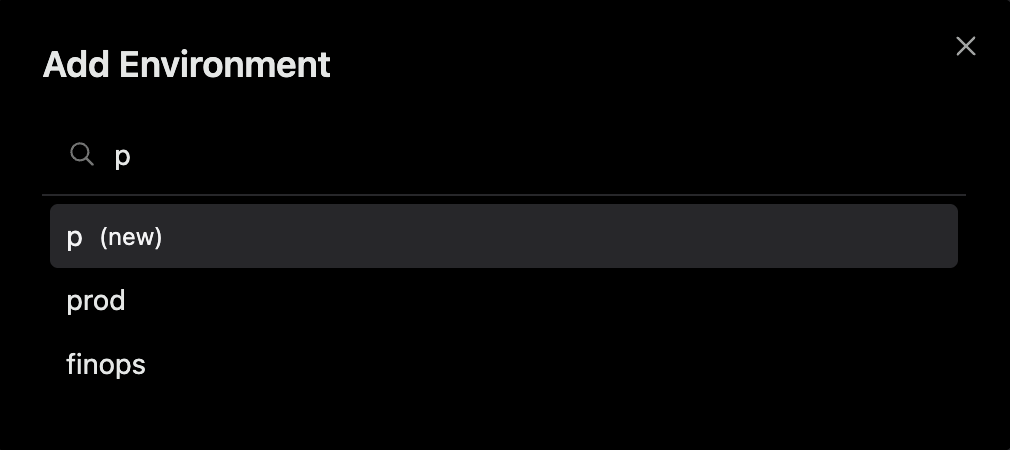
Environments can be assigned to a resource by selecting the resource to show the button to add a new environment. In the above screenshot we see the emailservice › server container has been selected and a ”+” button to add an environment is shown. When assigning an environment to a resource, all current environments are shown, and new environments can be created as well.
Environments can be removed from a resource by clicking the “x” that appears when hovering over the environment tag.
9. Issues
Section titled “9. Issues”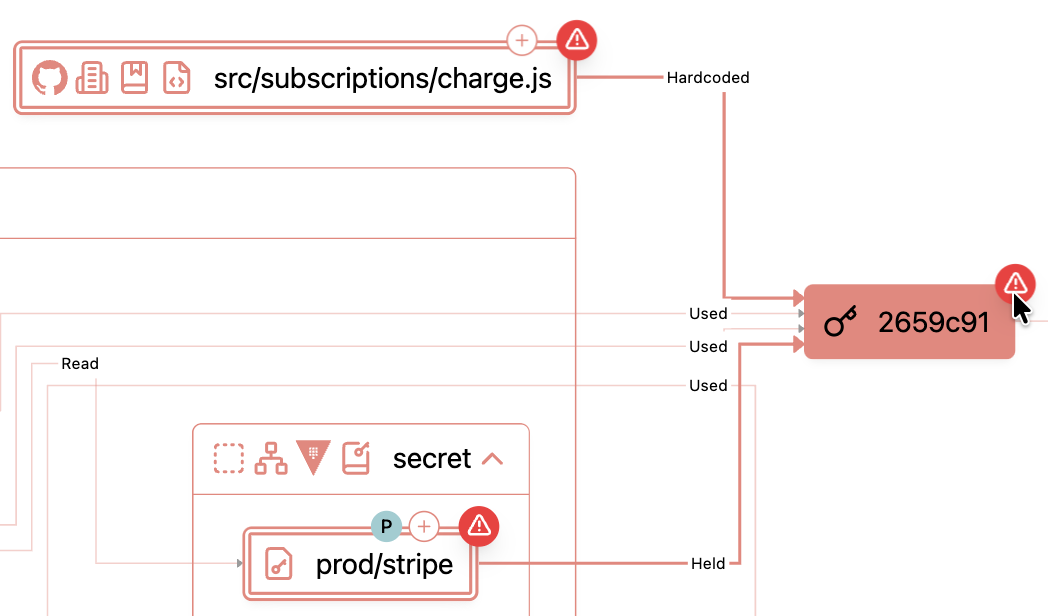
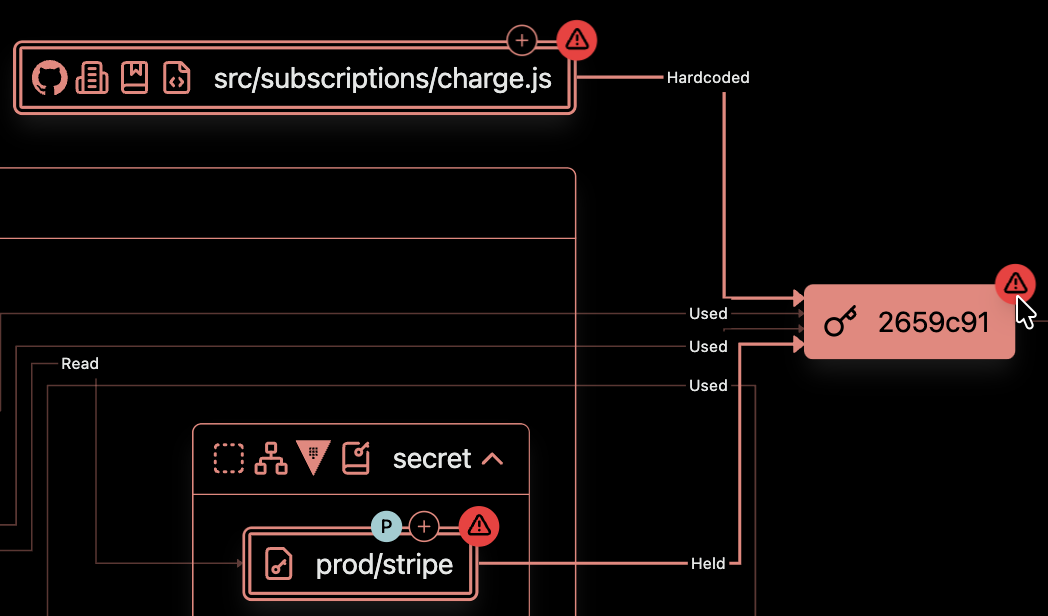
Archodex detects potential issues based on observed events and resource configurations. When an issue is detected, an issue badge appears on the affected resource in the Graph View. In the above screenshot the issue badge on a Secret Value was clicked, which highlighted the events and associated resources for all issues related to that Secret Value. Clicking on an issue badge will also show the Issues Table, where more information on each issue can be found.